
.jpeg)
Climate change has shifted from a distant concern to a pressing business reality. Companies are under growing pressure from regulators, investors, and customers to take accountability for the emissions linked to their operations. But responsibility doesn’t stop at the factory gate or office walls. The real challenge lies in understanding the full picture—where emissions come from, how they are categorized, and what they reveal about a company’s environmental impact.
Breaking emissions into clear categories provides a roadmap for action. It helps organizations see not only the direct pollution from their activities but also the indirect consequences hidden in supply chains, transportation, and even how their products are used after purchase. Without this structured approach, climate commitments risk becoming vague promises rather than measurable progress.
Let’s understand what are scope 1 2 and 3 emissions and how they differ from each other for businesses to navigate ESG reporting seamlessly.
What are Scope 1, 2, and 3 Emissions?
To create accountability in climate reporting, the Greenhouse Gas (GHG) Protocol divides emissions into three categories: Scope 1, Scope 2, and Scope 3. These categories help businesses measure their total footprint across direct and indirect activities.
- Scope 1 Emissions – Direct Emissions
These are emissions released from sources a company owns or controls directly. Examples include fuel burned in company vehicles, emissions from onsite boilers or furnaces, or leaks from refrigerants. If a business physically operates the source, its emissions fall under Scope 1. - Scope 2 Emissions – Indirect Energy Emissions
Scope 2 covers emissions from the electricity, heating, cooling, or steam a company purchases. While the business doesn’t generate the energy itself, it is responsible for the emissions created by utilities to provide it. - Scope 3 Emissions – Value Chain Emissions
Scope 3 is the broadest category, accounting for all other indirect emissions that occur in a company’s value chain. This includes emissions from suppliers, business travel, product use, waste disposal, and even investments. For most organizations, Scope 3 makes up the majority of their carbon footprint.
Scope 1 vs 2 vs 3 Emissions: A Detailed Overview
The difference between scope 1 2 and 3 emissions becomes clearer when we compare them across key factors that shape how businesses measure, manage, and reduce their climate impact.
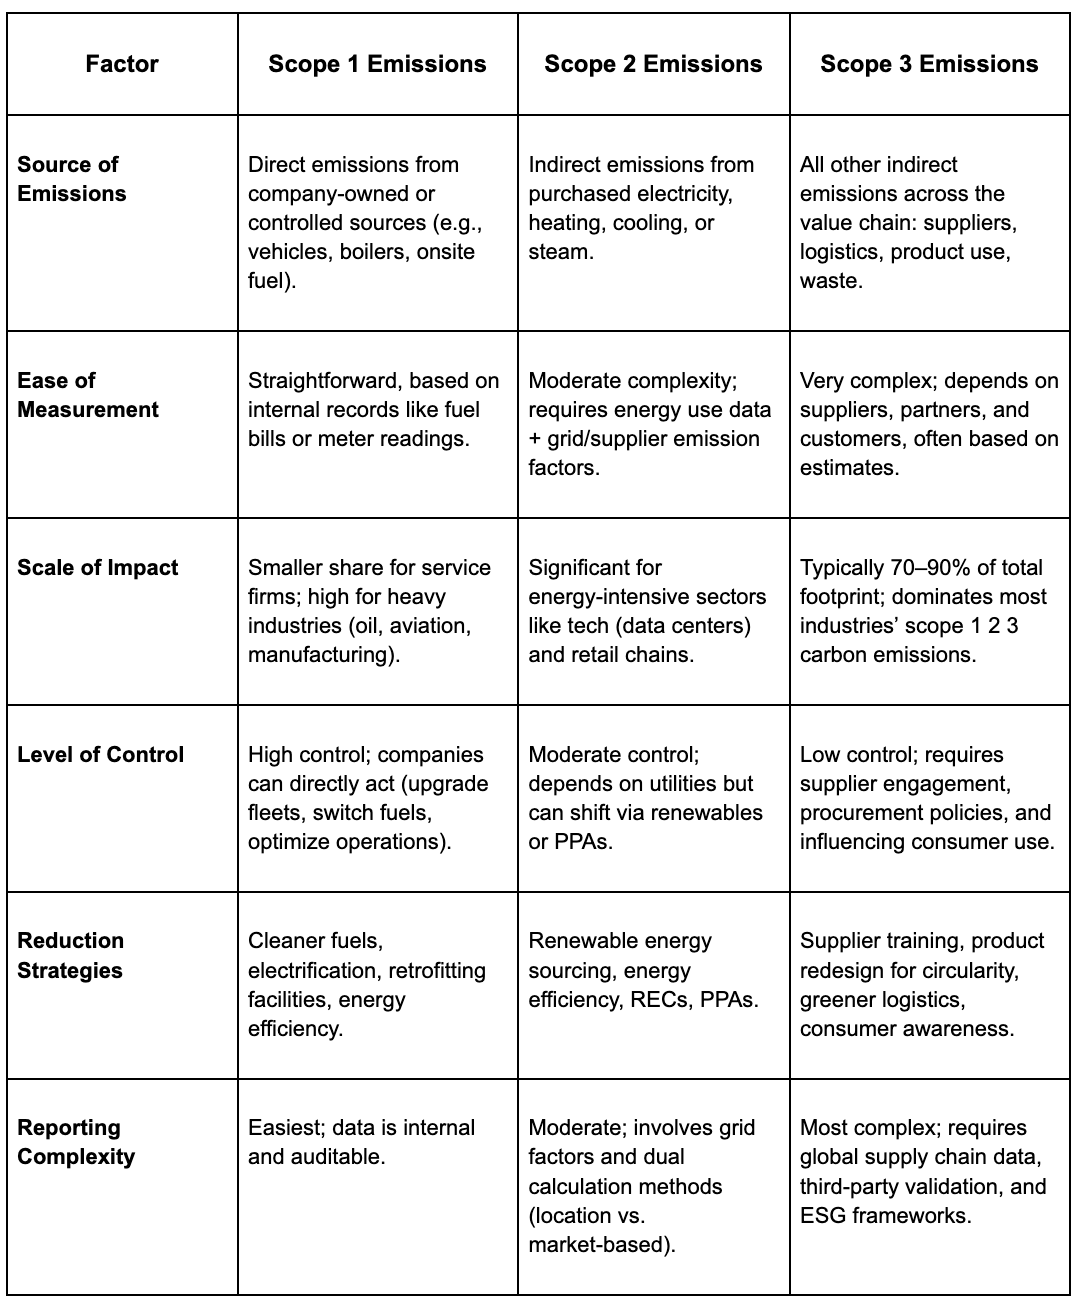
1. Source of Emissions
Scope 1 emissions come directly from sources owned or controlled by a company, such as burning fuel in vehicles or operating onsite equipment. These are emissions the business itself creates.
Scope 2 emissions, on the other hand, are indirect and tied to the energy a company purchases, like electricity or heating — they happen at the utility’s site but count toward the company’s footprint. Scope 3 emissions stretch much further, covering the entire value chain, from supplier operations to customer product use and disposal, making them the broadest and most complex category of scope 1 2 3 carbon emissions.
2. Ease of Measurement
Measuring Scope 1 emissions is typically straightforward because data comes from within the organization, such as fuel records or utility bills. Scope 2 emissions are slightly more complex, requiring not only energy consumption data but also emissions factors from grids or suppliers to calculate the true impact.
In contrast, Scope 3 emissions are the hardest to quantify, since they depend on external actors like suppliers, logistics providers, or consumers. This complexity is why most companies struggle to get accurate figures for the largest portion of their GHG emissions scope 1 2 3.
3. Scale of Impact
In terms of contribution, Scope 1 emissions may be significant for energy-intensive industries like oil, gas, or aviation but are relatively smaller for service-based businesses. Scope 2 emissions grow large in sectors that rely heavily on purchased electricity, such as tech companies with massive data centers or retailers with hundreds of stores. Scope 3 emissions.
However, usually dominate, often accounting for 70–90% of a company’s total footprint. Whether it’s supply chains, product use, or end-of-life treatment, Scope 3 defines the bulk of what is scope 1 2 3 emissions in practice.
4. Level of Control
Companies have the most control over Scope 1 emissions, since they arise from activities they own and operate. Upgrading fleets, switching fuels, or improving efficiency can directly reduce these numbers. Scope 2 emissions are less controllable, because they depend on how utilities generate energy, though companies can influence outcomes by purchasing renewable energy or entering Power Purchase Agreements (PPAs). Scope 3 emissions sit at the lowest level of control, as they rely on external actors.
Reductions often require supplier engagement, changes in procurement, and even influencing consumer behavior. This sharp contrast illustrates why businesses must balance direct action with collaboration when tackling scope 1 vs 2 vs 3 emissions.
5. Reduction Strategies
For Scope 1, strategies focus on cleaner operations: electrifying vehicles, switching to low-carbon fuels, or retrofitting facilities. Scope 2 reductions often come from investing in energy efficiency, installing renewables, or buying Renewable Energy Certificates (RECs). Tackling Scope 3 emissions demands systemic efforts: training suppliers to decarbonize, redesigning products for circularity, optimizing logistics, and supporting sustainable consumption.
The difference in approaches shows how each scope requires tailored solutions, not one-size-fits-all fixes, to cut scope 1 2 3 carbon emissions effectively.
6. Reporting and Disclosure Complexity
Reporting Scope 1 emissions is the most straightforward because companies already track fuel use and direct emissions data. Scope 2 disclosures are moderately complex, as they involve different calculation methods (market-based vs. location-based) and must reflect grid variations.
Scope 3 reporting is by far the most challenging, requiring coordination across supply chains, independent verification, and alignment with frameworks like CDP or GRI. This is where most businesses face scrutiny, since Scope 3 is both the largest and the hardest part of GHG emissions scope 1 2 3 to prove with confidence.
How to Measure Scope 1 2 3 Carbon Emissions?
Measuring scope 1 2 3 carbon emissions requires a structured process that covers direct operations, purchased energy, and the broader value chain. Here’s how businesses can approach it:
Step 1: Define Boundaries
The first step is setting the organizational and operational boundaries for reporting. This means deciding which facilities, activities, and value chain processes to include across Scope 1, Scope 2, and Scope 3. Scope 1 and 2 are relatively straightforward, but Scope 3 is complex and often underreported since it involves suppliers, transport, and product use.
AI-powered platforms like Breathe ESG ensure boundaries align with the GHG Protocol, helping businesses avoid blind spots and ensuring Scope 3 is fully considered.
Step 2: Collect Activity Data
After boundaries are clear, businesses must gather the raw data—utility bills, fuel usage, company fleet mileage, supplier disclosures, and even end-of-life product details. This can be extremely resource-intensive when data comes from dozens of suppliers and systems.
Breathe Zero automates supplier engagement and centralizes inputs, so companies don’t waste time chasing fragmented information.
Step 3: Apply Emission Factors
Collected data is then converted into carbon values using emission factors. For example, liters of diesel burned are multiplied by a standard factor to calculate CO₂e. The challenge is ensuring accuracy by applying the correct factors for every activity. Breathe ESG simplifies the process by integrating verified emission factor libraries, automatically applying the right conversion so results are accurate and audit-ready.
Step 4: Consolidate and Analyze Results
With calculations done, results must be consolidated across all three scopes. Businesses use this stage to identify hotspots—like high energy consumption in Scope 2 or supplier emissions in Scope 3—and model reduction strategies.
Step 5: Verify and Report
Finally, emissions data must be verified for credibility and disclosed in line with frameworks like CDP, GRI, or TCFD. This step is critical for building stakeholder trust and passing audits. Breathe ESG generates assurance-ready disclosures aligned with global frameworks, making verification seamless and strengthening transparency.
How to Reduce Scope 1 2 3 Emissions?
Reducing scope 1 2 3 carbon emissions is not just about compliance—it’s about building long-term resilience and credibility in sustainability strategy. Businesses must approach reductions systematically across all scopes:
Improve Operational Efficiency
Scope 1 emissions come directly from company operations—fuel combustion, company fleets, industrial processes. Reductions often begin with upgrading machinery, transitioning fleets to electric or hybrid vehicles, and implementing energy efficiency in production. To support this, Breathe ESG helps track reductions in real time, flagging inefficiencies and quantifying the impact of operational upgrades across Scope 1.
Transition to Renewable Energy
Scope 2 reductions focus on electricity, heating, and cooling. The most effective strategies include installing on-site solar or wind, entering into power purchase agreements (PPAs), or procuring renewable energy certificates (RECs).
With Breathe ESG, companies can model renewable energy adoption scenarios and automatically integrate RECs into their emissions reporting, ensuring transparency and credibility.
Engage the Supply Chain
Scope 3 emissions usually account for the majority of a business’s footprint. Companies must work with suppliers to set reduction targets, encourage renewable adoption, and prefer low-carbon sourcing. This requires collaboration and constant monitoring.
Optimize Logistics and Transportation
Both Scope 1 and Scope 3 are heavily influenced by transport. Businesses can reduce emissions by shifting from air to rail/sea freight, optimizing delivery routes, and adopting electric or hydrogen-powered fleets.
Step 5: Foster Circular Economy Practices
Product design and lifecycle management directly affect Scope 3. Strategies like designing for reuse, recycling, and product take-back programs extend lifecycle value while cutting emissions.
Breathe ESG tracks lifecycle emissions and supports reporting aligned with circular economy goals, ensuring companies can showcase progress with measurable data.
Turning Scope 1, 2 and 3 Insights Into Impact
Tackling scope 1 2 3 emissions is one of the most important steps businesses can take toward meaningful climate action. These categories reveal the full extent of an organization’s environmental footprint, from direct operations to purchased energy and supply chain impacts.
This is where Breathe ESG provides unmatched support.
With AI-powered tools, it simplifies data collection, automates calculations, and delivers assurance-ready disclosures. From managing complex Scope 3 supplier data to providing insight for science-based targets, Breathe ESG turns sustainability goals into measurable results. With Breathe, businesses can confidently transform ambition into credible, verifiable progress on their path to net zero.
Book a call and discover how to streamline scope 1, 2 & 3 emissions tracking.
FAQs
What are the scope 1 and 2 emissions in the US?
In the US, scope 1 emissions come from direct company activities like fuel combustion in boilers, furnaces, and company vehicles. Scope 2 emissions are indirect, resulting from purchased electricity, heat, or steam. Both categories are central to corporate carbon accounting because they reflect energy choices and operational efficiency, forming the foundation for regulatory reporting and climate strategies.
What is the difference between scope 2 and 3?
Scope 2 emissions cover indirect greenhouse gases from purchased energy—electricity, heating, or cooling consumed by an organization. Scope 3 emissions, on the other hand, include all other indirect emissions in the value chain, such as supplier activities, transportation, product use, and disposal. The key difference is scale: scope 2 is limited to energy, while scope 3 extends across the entire supply chain.
How to calculate scope 1, 2, and 3 emissions?
Calculating emissions involves collecting activity data and applying standardized emission factors. Scope 1 uses direct fuel consumption data, scope 2 requires energy bills and regional grid emission factors, and scope 3 relies on supplier disclosures, logistics data, and life cycle assessments. Companies often use greenhouse gas protocols and carbon accounting software to standardize results, ensuring consistency, transparency, and assurance-ready reporting across all scopes.
Do all companies have scope 3 emissions?
Yes, nearly all companies generate scope 3 emissions because they account for upstream and downstream activities. Even service-based firms with minimal operations still rely on purchased goods, employee commuting, digital infrastructure, and waste management. For manufacturers and retailers, scope 3 can make up over 70% of their total footprint, making it the most complex but critical category to address for meaningful climate impact.

